
 BETA
BETAYou may have heard of the incident where a helium leak suddenly disabled many iPhones at a medical facility. The root cause — tiny MEMS oscillators being susceptible to helium leaking into their hermetically-sealed casings — is interesting but not especially surprising. Helium is the second lightest element in the periodic table; helium atoms are tiny and have a knack for diffusing through all sorts of barriers.
What is very interesting, though, is that the helium exposure causes the frequency of the oscillator to go up rather than down (at least initially before more serious failures occur). In an experiment performed in a YouTube video from Applied Science, the frequency increases from 32768.24 Hz to 32768.70 Hz (14 parts per million) before device failure. In a research paper, which exposes a (different) MEMS oscillator to helium at high pressure over 50 hours, the frequency increases from 30418 Hz to 30501 Hz which is over 2700 ppm!
If the oscillators weren’t hermetically sealed, then the frequency increase would be understandable — helium is lighter than air, and we all know what happens when we breathe in helium. But normally the oscillators are under near-vacuum conditions. Intuitively one would expect the addition of helium atoms to slow down the oscillation, either via gas damping or mass increase. Neither the YouTube video nor the mentioned research paper explain why the frequency increases.
Brief background on MEMS oscillators
While there are a number of different designs, fundamentally a MEMS oscillator consists of a tiny structure that is mostly free to vibrate, attached to the substrate only at a small number of anchor points via thin bridges/springs. Such a structure will have certain natural frequencies that it ‘wants’ to oscillate at, just like a tuning fork.
In the majority of designs (capacitively-coupled), there are then two electrodes placed close to the resonating structure: a sense electrode capacitively reads out oscillations of the resonating structure; the signal is fed back via a sustaining amplifier to a drive electrode, which reinforces the oscillations.
Physically the SiTime device used in the affected iPhones is an ‘H-style tuning fork’ that looks like this:
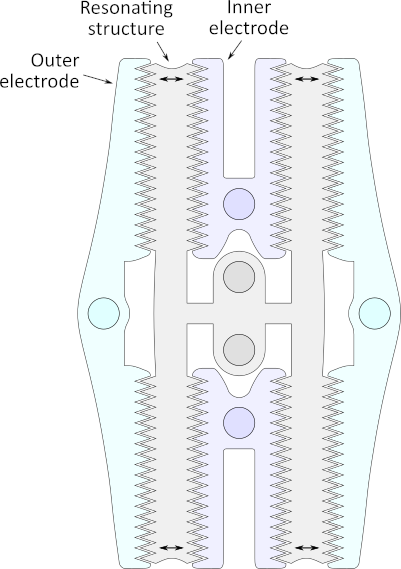
I drew this diagram from the fantastic electron micrograph in Applied Science’s YouTube video at 15:39. I do not know which of the two electrodes are used as the driving and sensing electrodes so I have simply labelled them as ‘inner’ and ‘outer’ (if you know which is which please let me know).
To put the size in perspective, the whole device depicted above is less than half a millimeter on each edge, and is fabricated within layers of a mostly-conventional integrated circuit fabrication process. In SiTime’s process, I believe all three parts depicted above are patterned within a single layer of crystalline silicon; the oxide above and below the resonating structure is then etched away leaving it suspended freely. The spaces are evacuated to near-vacuum and the device hermetically sealed.
It’s interesting to note how little space there is between the tuning fork and electrodes: everyday intuition suggests the tuning fork will hit the electrodes when it oscillates, but the oscillations are kept very small, which does not change the oscillating mode but maximises capacitance and device linearity.
Initial hypotheses
When the device is exposed to helium, helium will diffuse both into the silicon and into gaps in the above structure. I briefly considered two hypotheses to explain the increase in oscillation frequency, although I think neither are sufficient to explain the observed magnitude of the increase:
- That helium increases the capacitance between the driving electrode and the resonating structure, and thus increases the drive force for a given voltage. While this may be true, the effect should be minuscule. Even at standard temperature and pressure, helium gas only has a dielectric constant of 1.0000684 (vacuum plus 68 ppm), and the amount of helium that makes it into the cavity in the original accidental exposure scenario should be far far less.
- That helium atoms within the silicon lattice cause a change in the elastic modulus of the silicon resonator. I haven’t attempted any sort of theoretical calculation of this, but I would say that this effect should also be minuscule. Again we are talking about a small amount of helium that has diffused into a very small proportion of interstitial sites in the silicon lattice.
I would suggest that the reason for the frequency increase may be much simpler: decreasing resonator Q factor can change the operating point of the oscillator circuit.
Brief background on resonator Q factor
Q factor is a dimensionless quantity related to the the energy lost per oscillation (where higher values mean less energy loss). The MEMS tuning fork is normally vibrating in a near-vacuum, which minimizes the energy loss and allows high Q factors of the order of 50,000 to be achieved. If gas is introduced, gas damping reduces the Q factor; to a first order approximation Q factor is inversely proportional to pressure. Taken at face value this would mean that a doubling of pressure would halve Q, but this is not true at very low pressures because then the majority of energy loss is due to other factors (thermoelastic damping and energy transmission into the anchor points). In any case when starting from very high Q, halving of resonator Q could happen at low pressures even below 10 millitorr (1/76,000 of atmospheric pressure) (paper 1 figure 4, paper 2 figure 9).
Modelling a MEMS resonator
To model the effect of changing the Q factor of a MEMS resonator, I constructed the following equivalent circuit (small-signal lumped-element model) for the SiTime MEMS resonator, based on the information in SiTime’s ISSC paper and other papers on MEMS resonators:
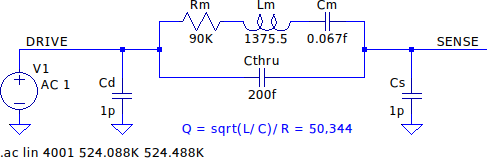
If you’ve ever modelled a quartz crystal, this is essentially the same circuit. A series RLC circuit is used to map the basic physics of a mass-spring system (Rm corresponds to damping co-efficient, Lm corresponds to mass, and Cm corresponds to the reciprocal of spring constant). Cthru represents feed-through capacitance from drive to source electrode, and Cd and Cs represent capacitance of the drive and source electrodes respectively.
I took my Rm, Lm and Cm values from SiTime’s paper, ‘unrounding’ them slightly to trim my frequency closer to the desired 524.288 kHz oscillation frequency (16x the standard real time clock frequency of 32.768 kHz). The SiTime paper does not give values for Cthru, Cd or Cs, so I’ve used values from another paper.
The resonator is driven by a sustaining amplifier which is basically an inverter in a Pierce oscillator configuration, plus a automatic gain control circuit that adjusts the gain of the inverter. For the purpose of this argument I’m not going to consider in detail the implementation of the sustaining amplifier, but rather consider the closed-loop feedback system:
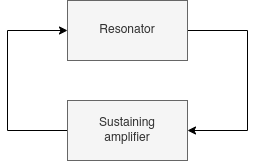
Whatever is inside the sustaining amplifier block, it must provide the right gain and phase shift to maintain constant oscillation: the total closed-loop phase shift must be a multiple of 360 degrees and the total closed-loop gain must be 1 (Berkhausen stability criterion).
Simulation results
Simulating the resonator model shown in Figure 2 produces the following frequency response:
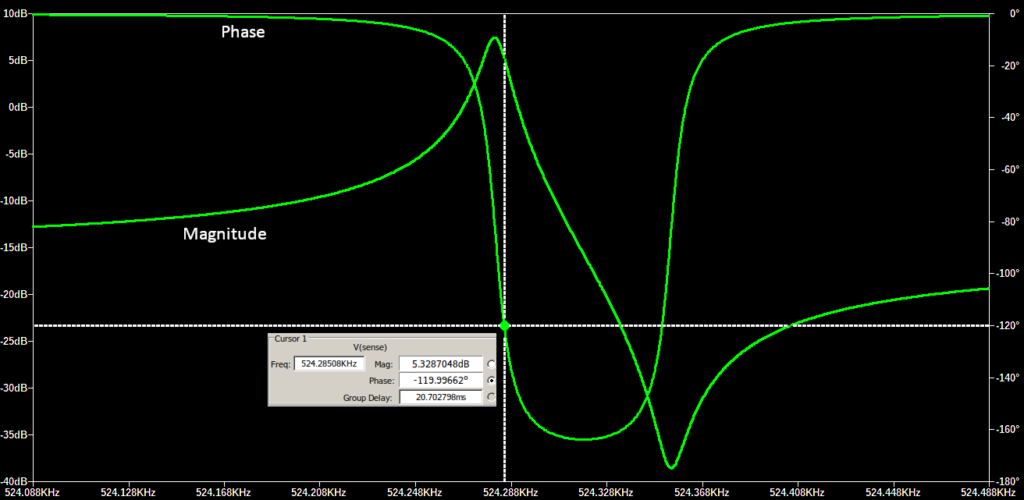
Let’s say the sustaining amplifier has a phase shift of 240 degrees around 524kHz (there is an effective 180 degree phase shift from inversion, and then some amount of extra phase shift from RC poles of the amplifier output). Then the system should oscillate at the marked point shown where the resonator provides 120 degrees of phase shift (f=524.28508 kHz). Because the Q is very large, the phase transition is very sharp and, regardless of the exact sustaining amplifier phase shift, it oscillates close to the resonance peak.
Now let’s say we introduce a small amount of helium into the cavity and the Q factor goes down from ~50K to ~23K (still very respectable), which I have modelled by increasing Rm to 200K. The blue line shows the new frequency response and new operating point:
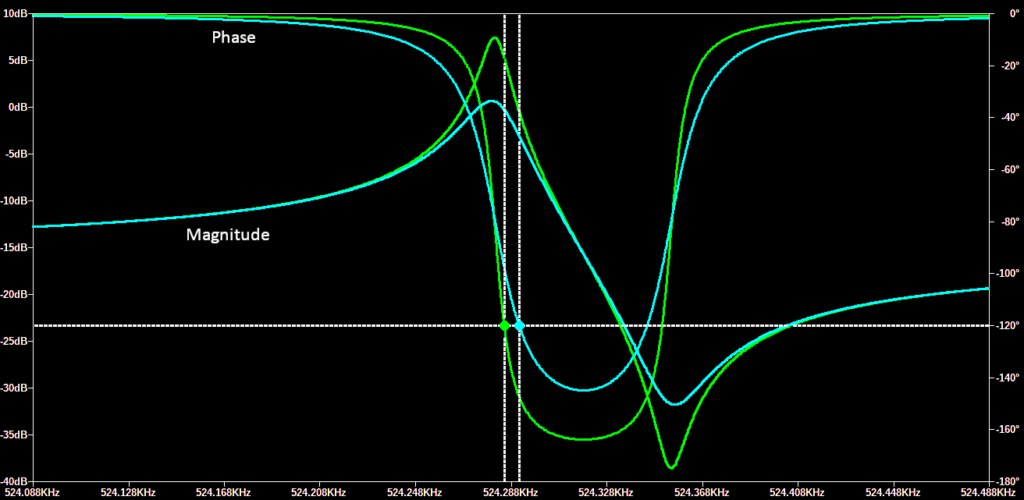
The phase transition behaviour is not as sharp as it was. Assuming the sustaining amplifier still provides a phase shift of 240 degrees, the system will now oscillate at the new point f=524.29136 kHz. The frequency has gone up by 12ppm!
Thus we can see that even with a modest change in Q, the frequency could easily increase by the 14ppm value observed experimentally.
There is something else that becomes evident from the above diagram: if Q continues to decrease, then the U-shaped phase plot will no longer intersect 120 degrees. At this point the closed loop system can no longer meet the conditions for oscillation, and the oscillation will stop. This might possibly be the explanation for the behaviour that happens beyond a certain point in the YouTube experiment, where the output frequency stops increasing and decays far outside the intended range. (The SiTime device contains a PLL after the MEMS oscillator, so this may be a case of the MEMS oscillator stopping, and the PLL ‘free-wheeling’ towards one end of its VCO range.)
Final notes
For the astute reader, I note that I have swept a couple of things under the carpet here:
- I’ve made the assumption that the sustaining amplifier still provides the same phase shift of 120° at the new operating point. Because it now operates at a different gain (and very slightly different frequency), the phase shift will change. Working out the new phase shift would require analysis of the sustaining amplifier circuit, and depend strongly on unpublished circuit details. The purpose of the above exercise was simply to show that quantum of the observed frequency increase is feasible based on the shape of the frequency response plot.
- For the high-Q case, the voltage transfer function of the simulated resonator actually comes out at +5dB, in other words the output voltage is higher than the input voltage. But then, the output impedance at this point is much higher than the input impedance, so there is no perpetual oscillation machine here. If you were to connect the output back to the input, the output voltage would drop below 0dB due to loading. Thus, the sustaining amplifier is still required in order to amplify the current.
Please let me know if you spot any errors in this post or if you have a better hypothesis.
